Live Stock Reports
Live Stock ReportsPopular Stock


Popular Crypto Currency


Your Ultimate Stock Market Toolkit
Get started now with our toolkit to empower you to pick your Perfect Portfolio
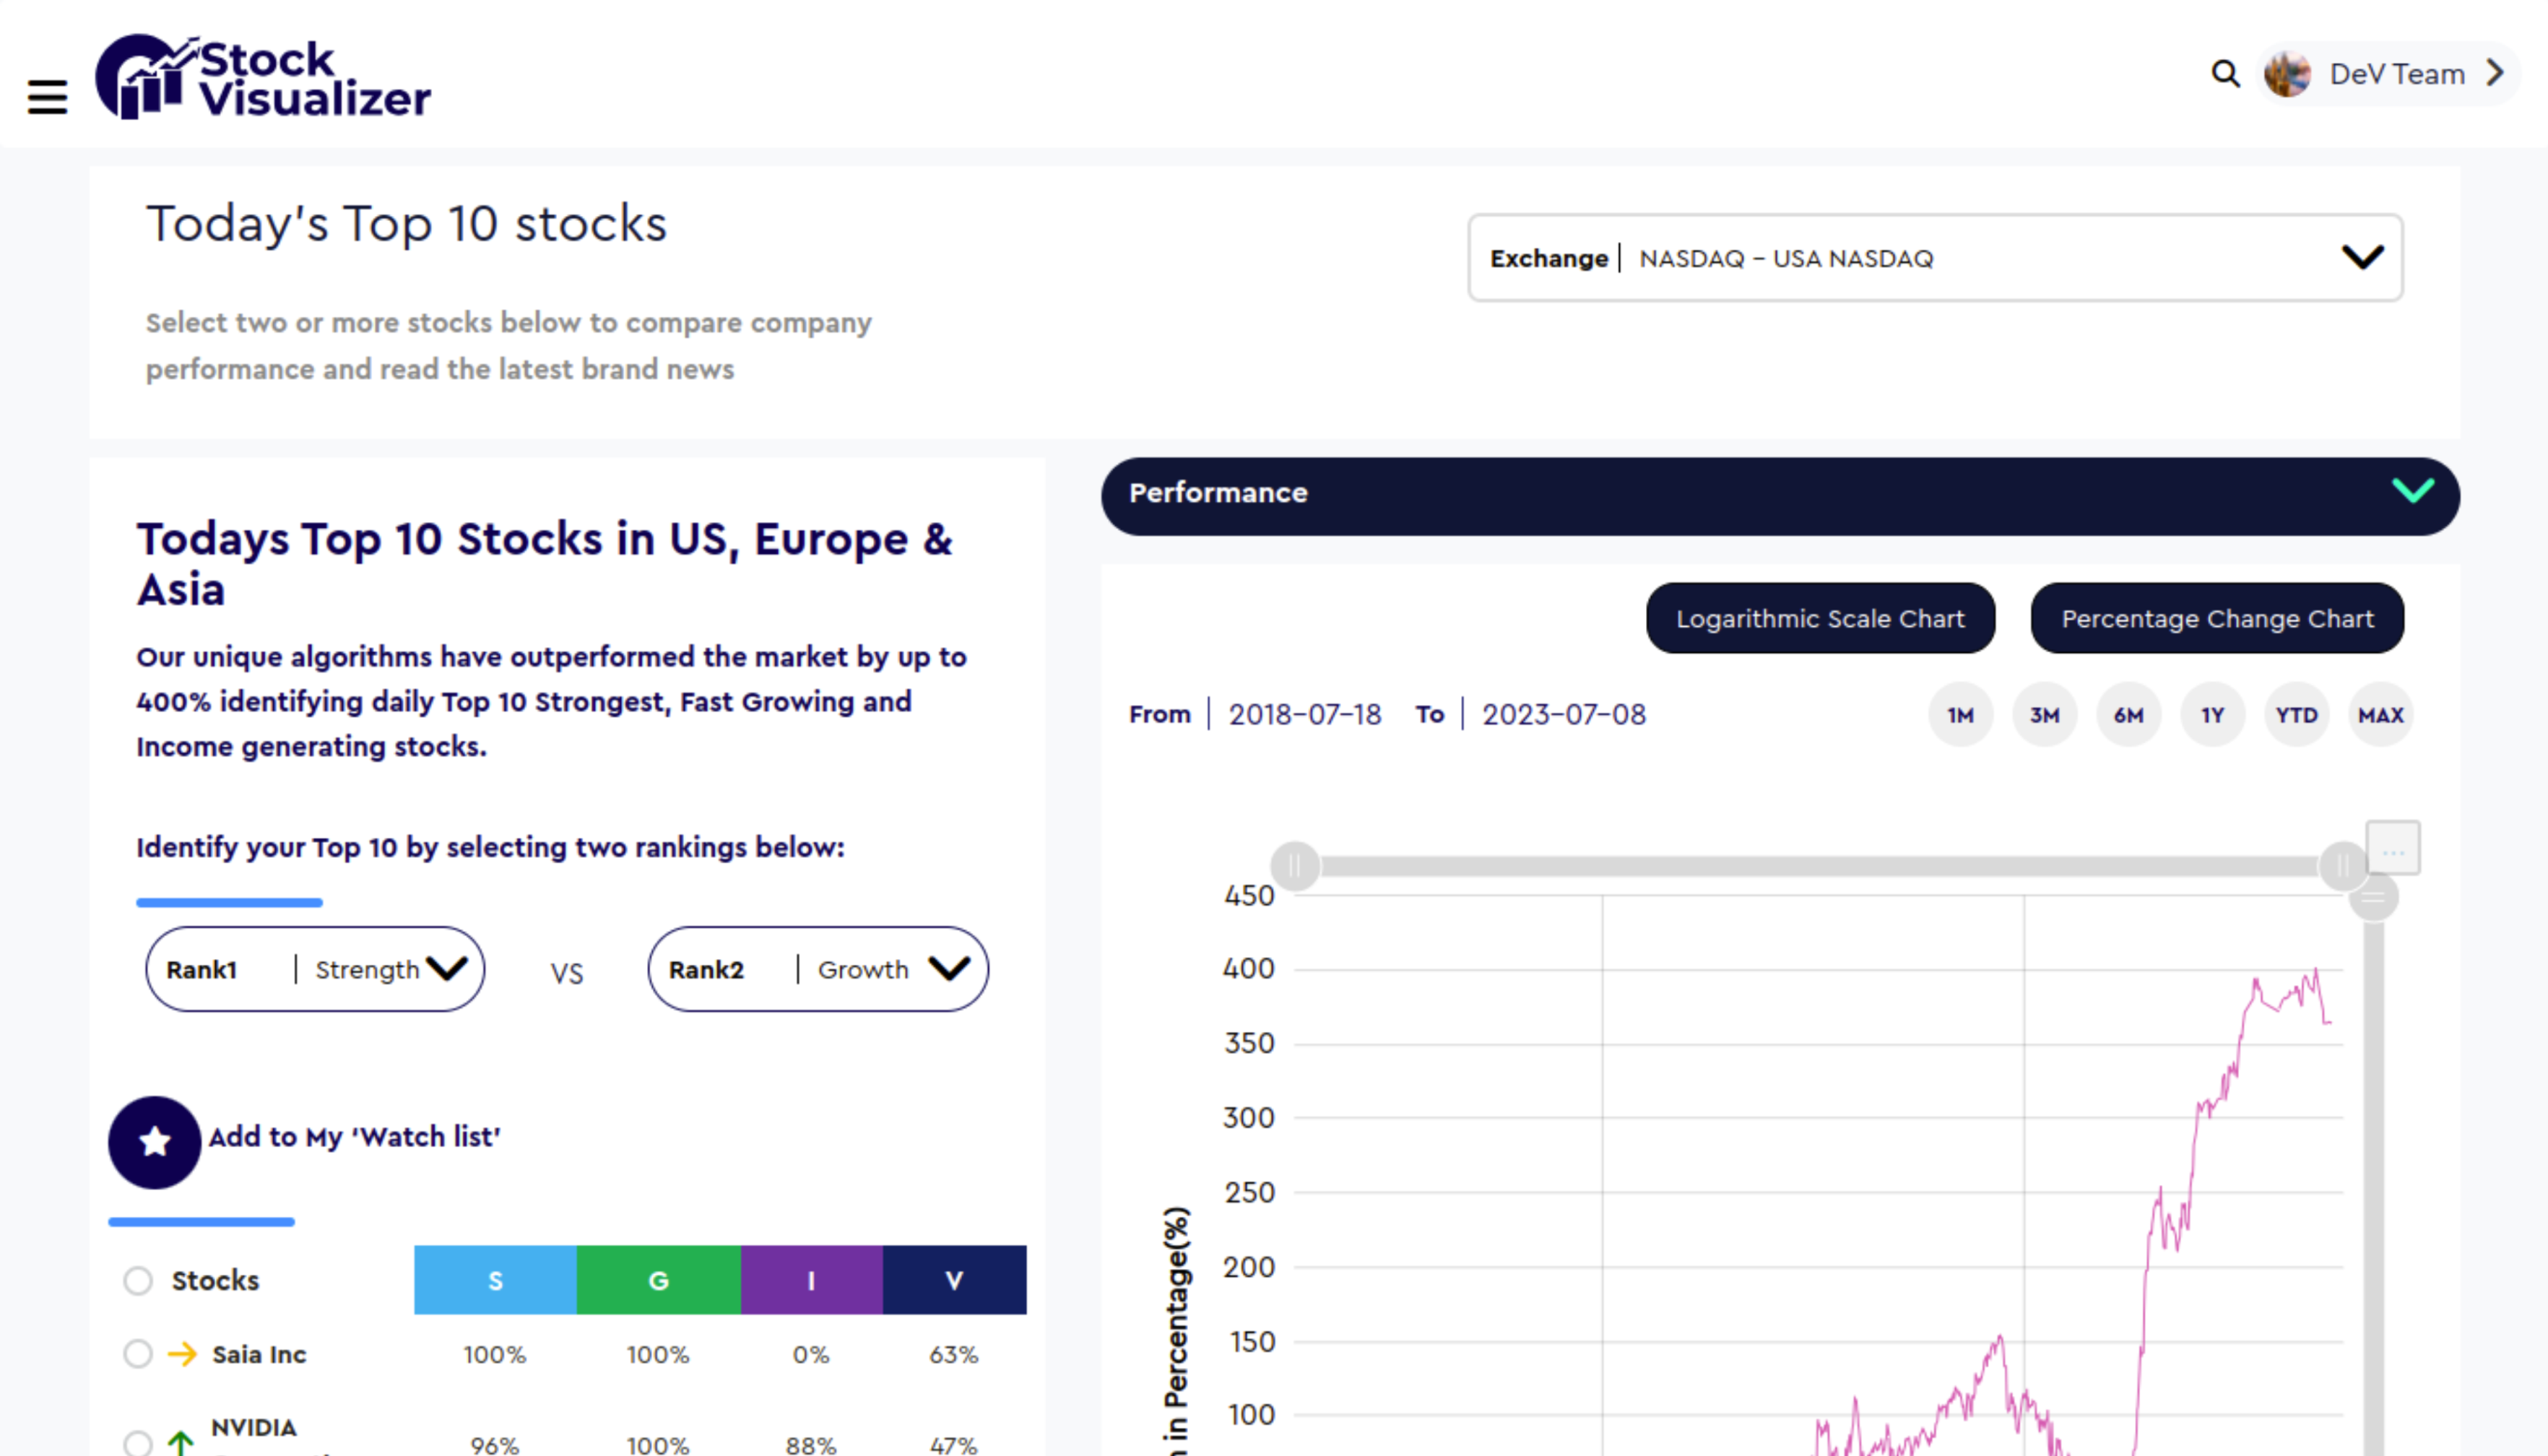
TODAYS TOP 10
Our Top 10 tool enables you to find stocks from around the world that have outperformed all market indexes – some by over 500% including the FTSE 100 in the UK.
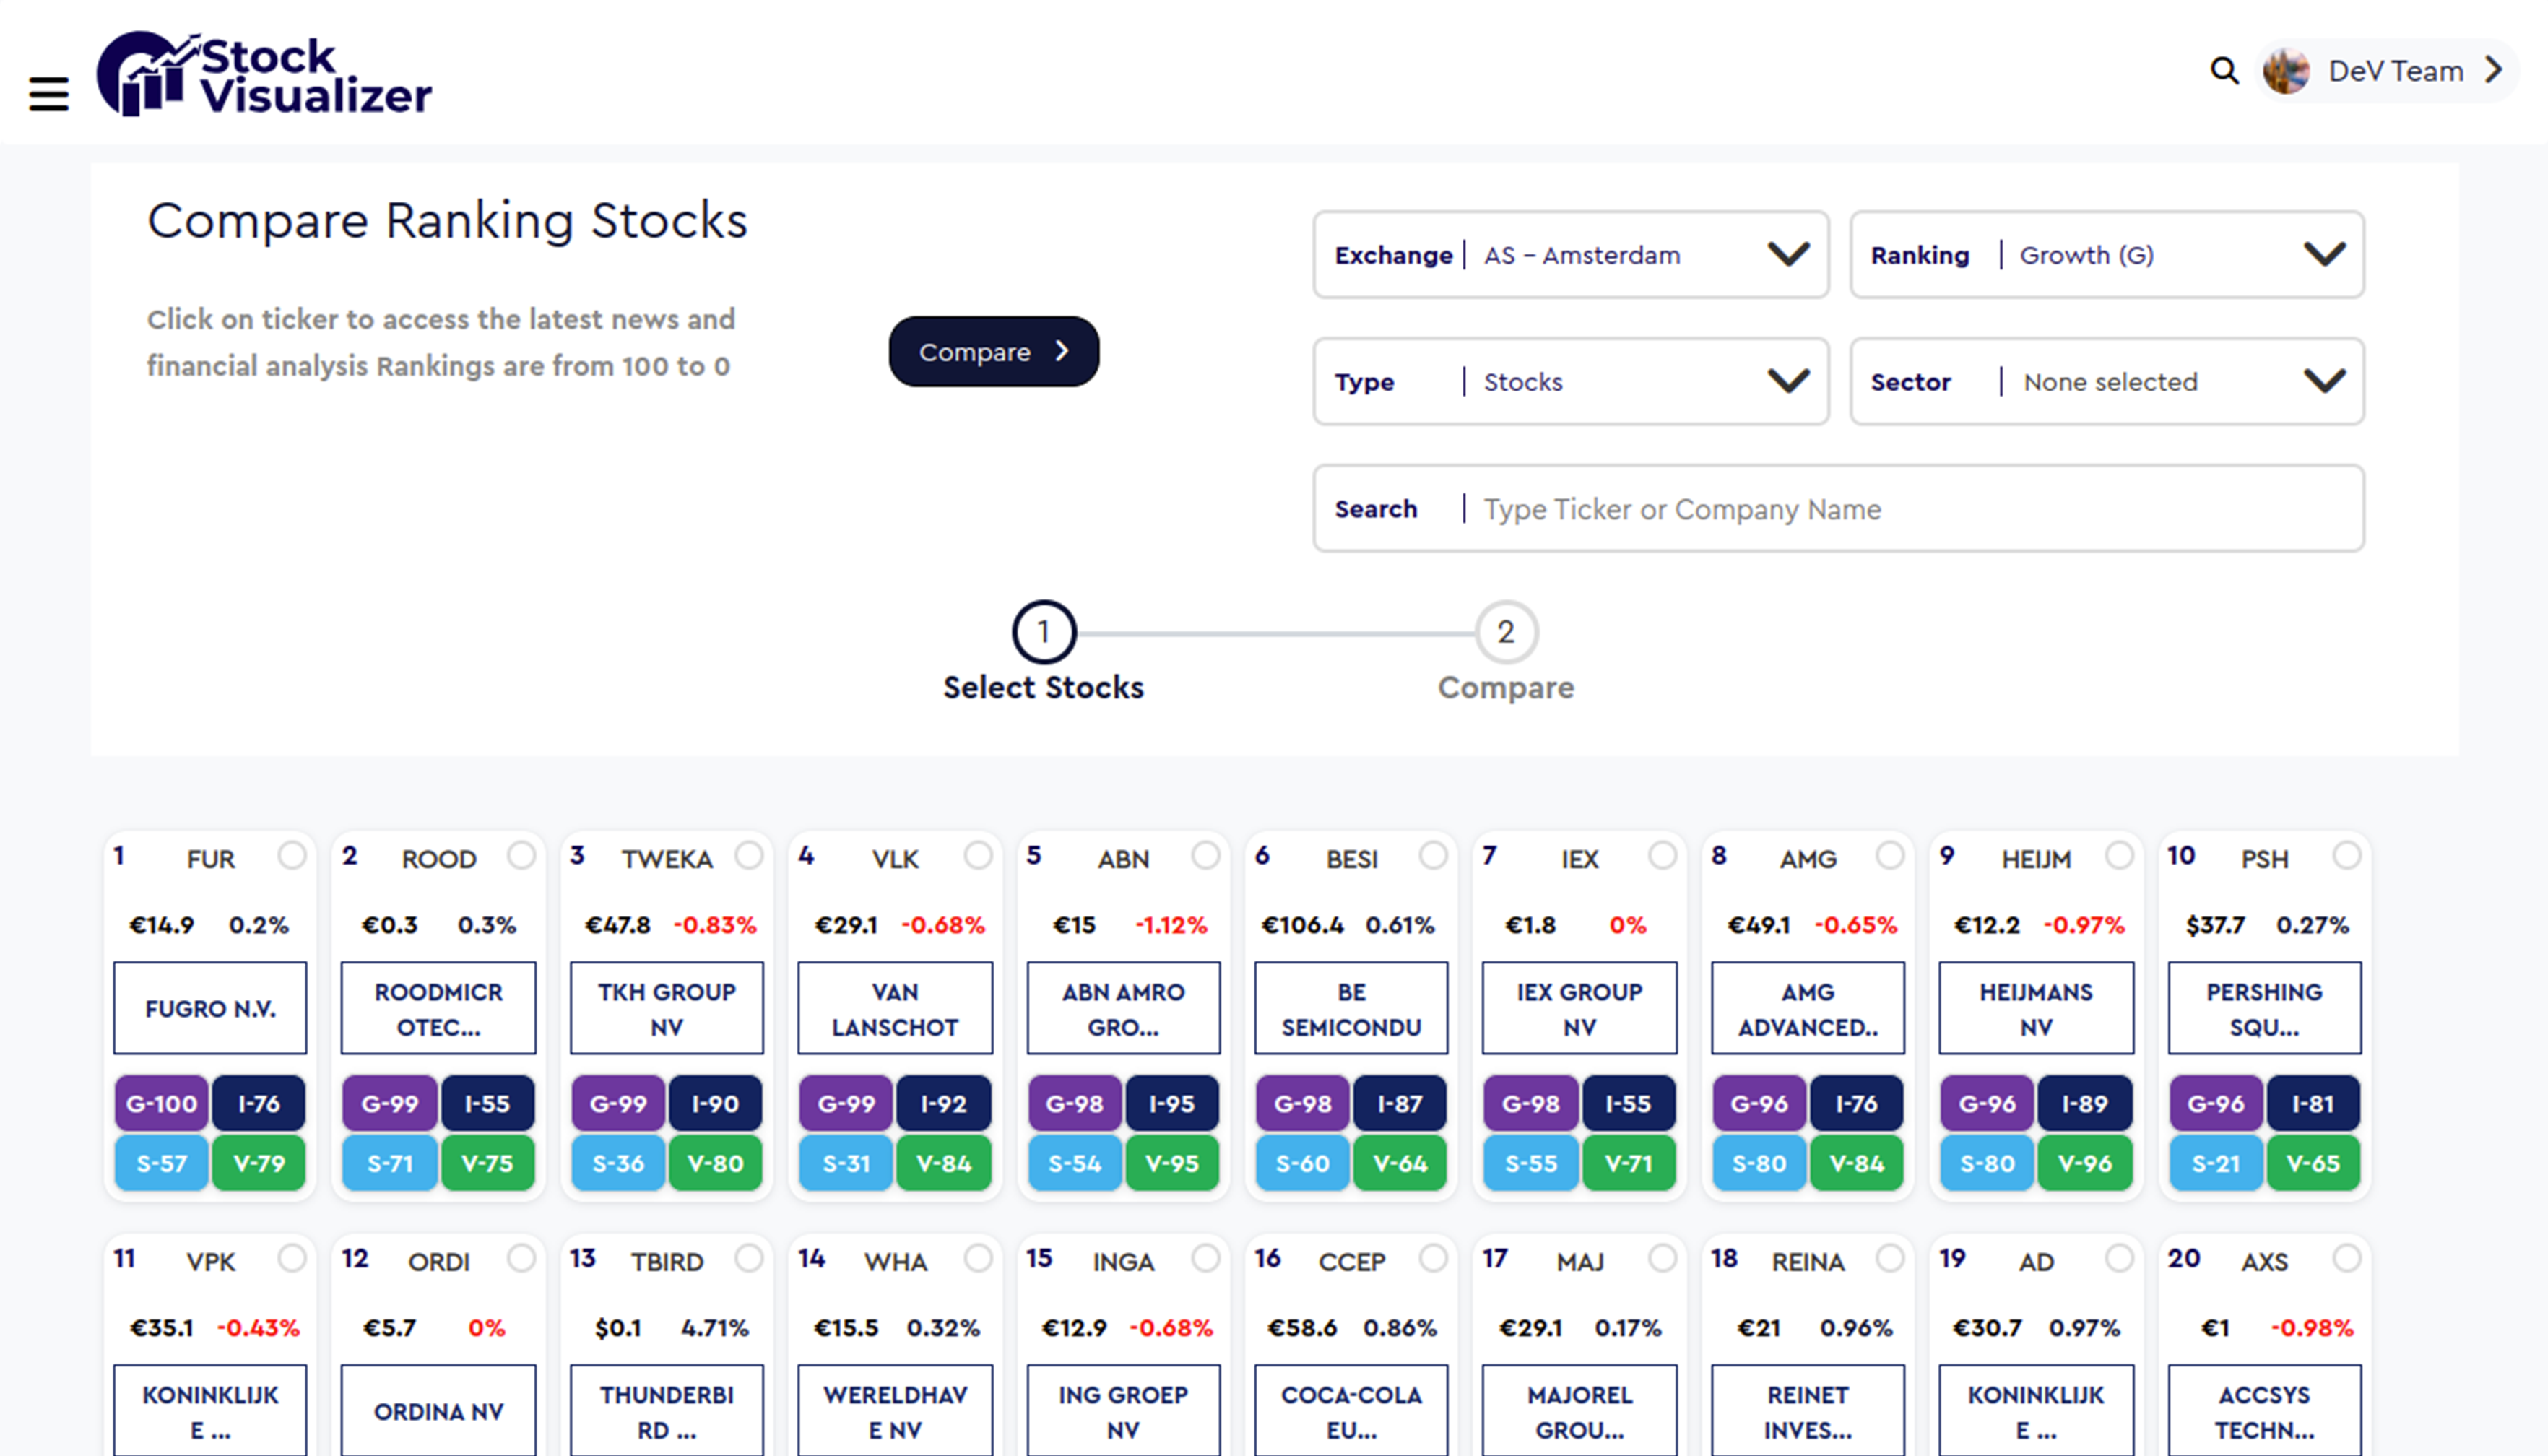
Compare Top Stocks
Compare Stocks, ETFs, Funds & investments Trusts within each exchange and sector. Our 4 Stock Visualizer rankings enable you to sort, chart and compare the best investments for your needs. All updated daily for the latest insights!
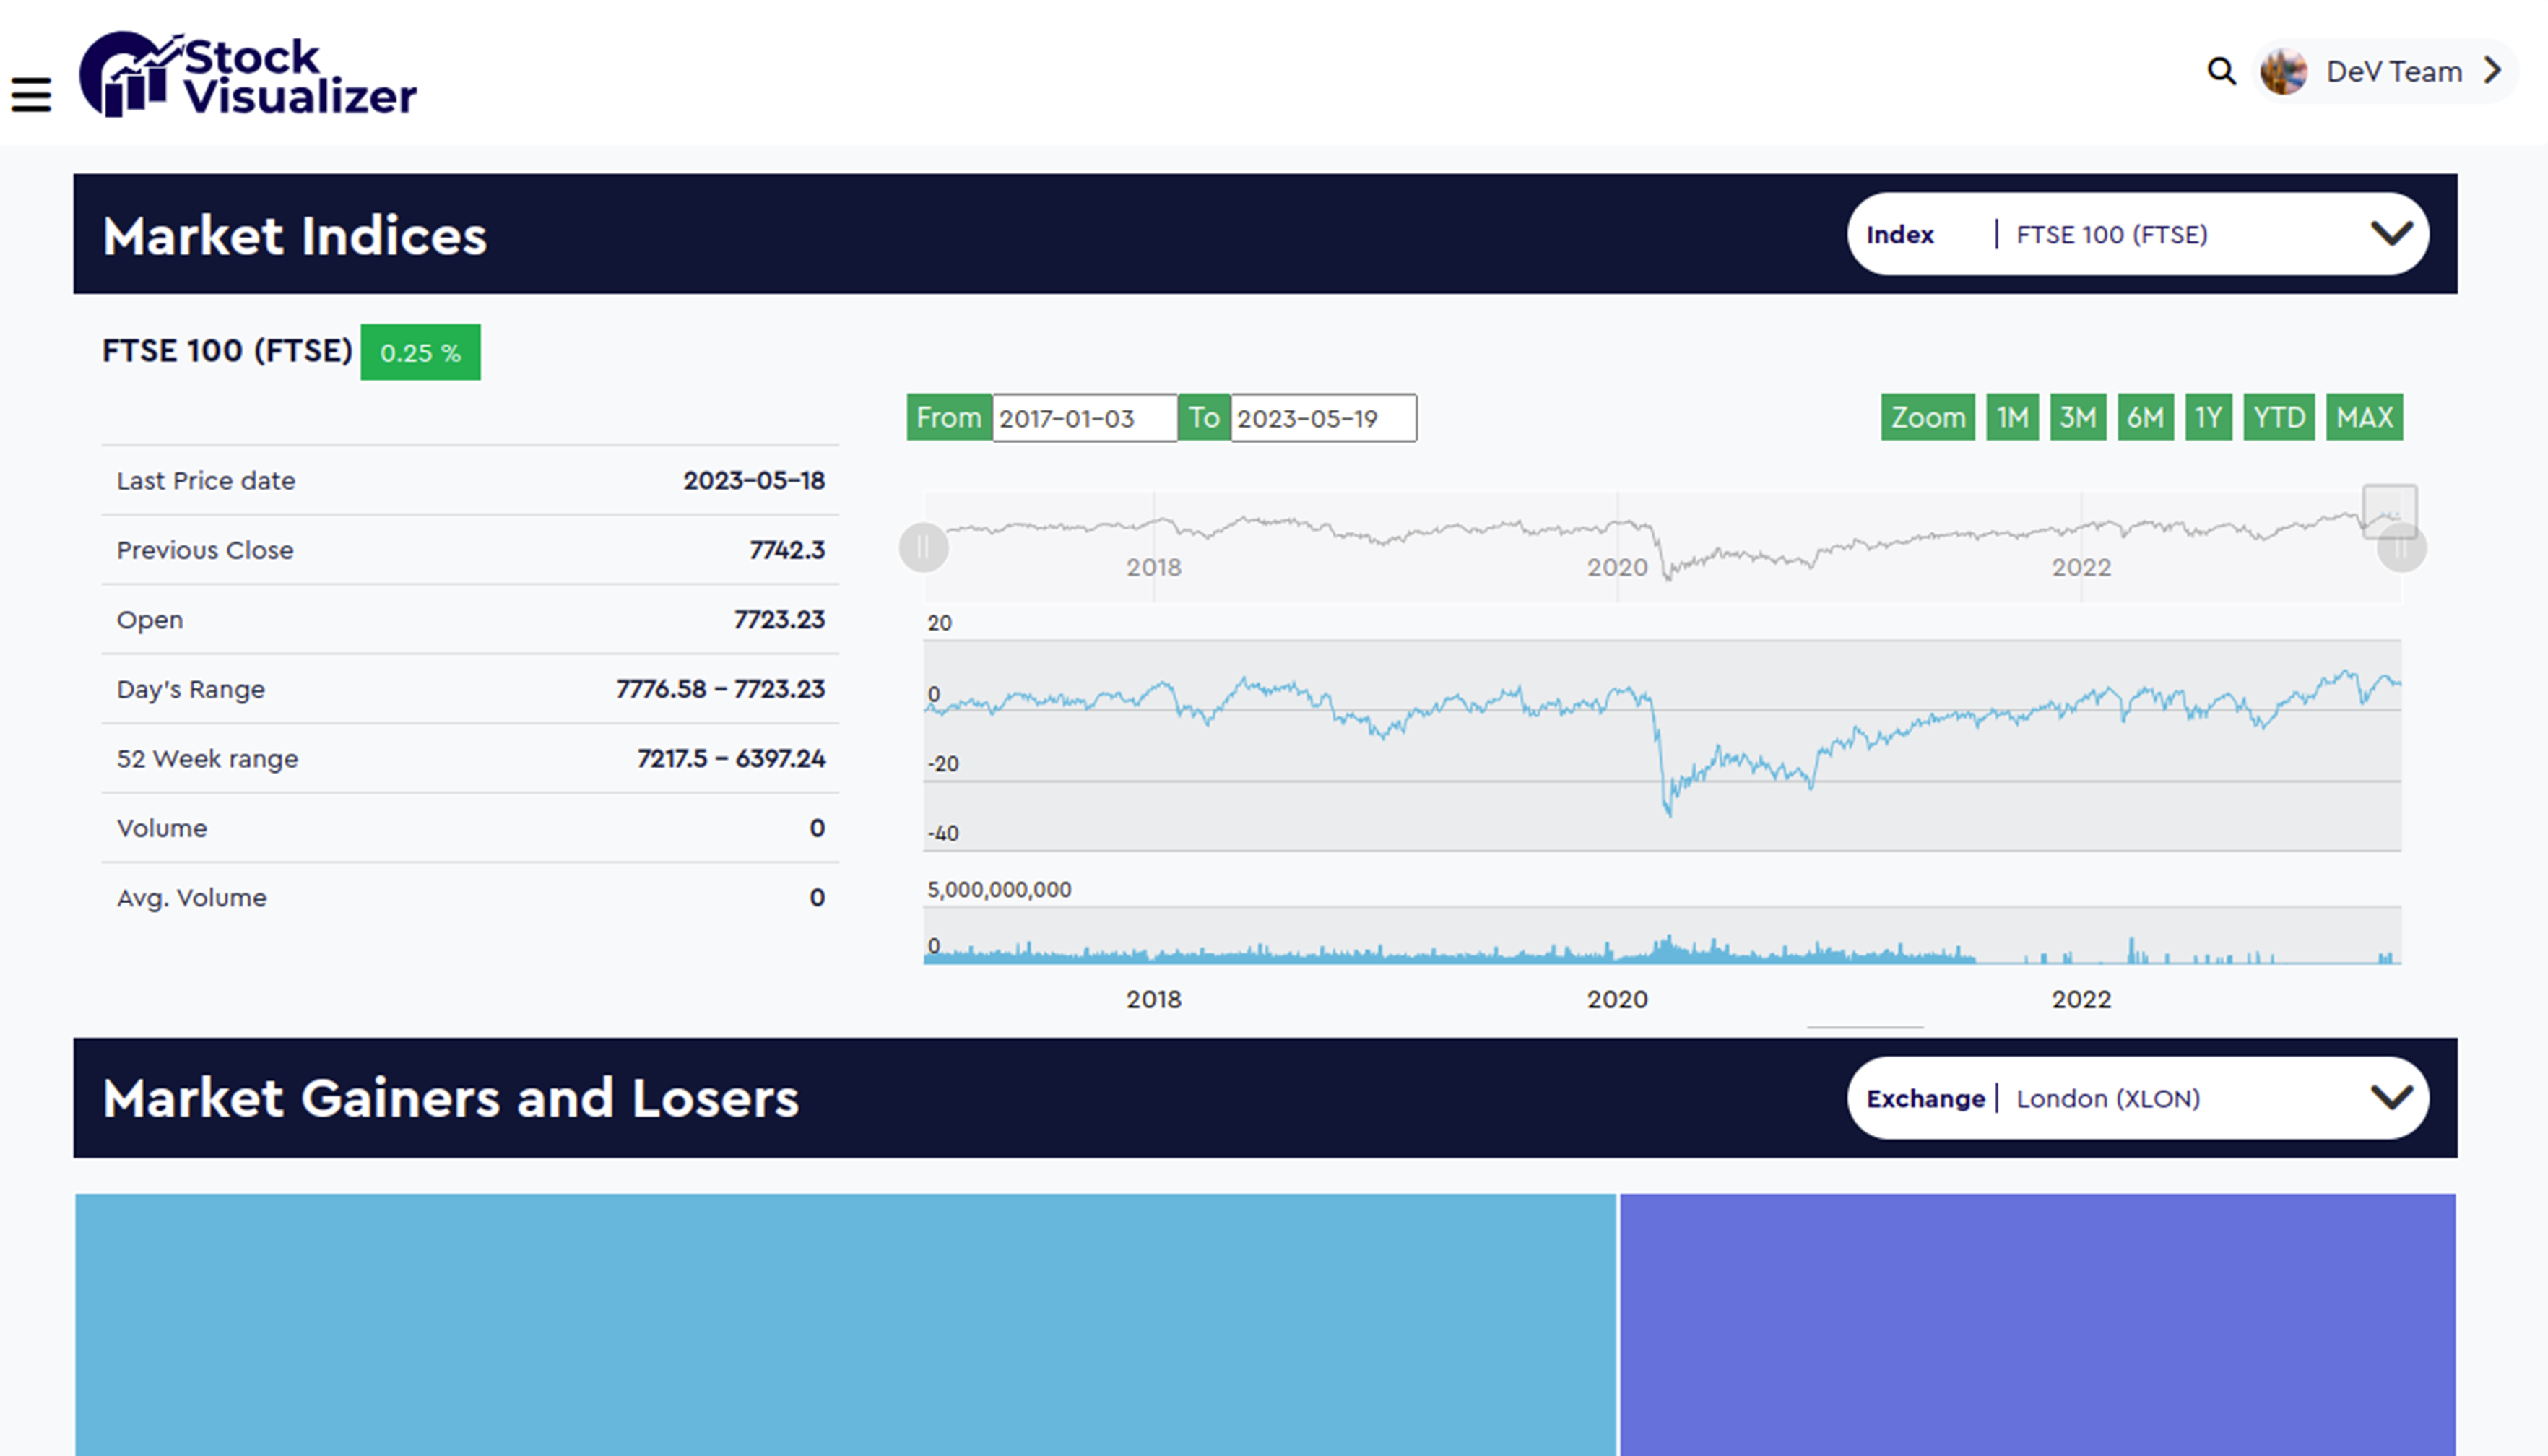
Markets
Explore where the market is moving. Which sectors are going up and down. Explore latest markets growth and find explore daily gainers and losers.
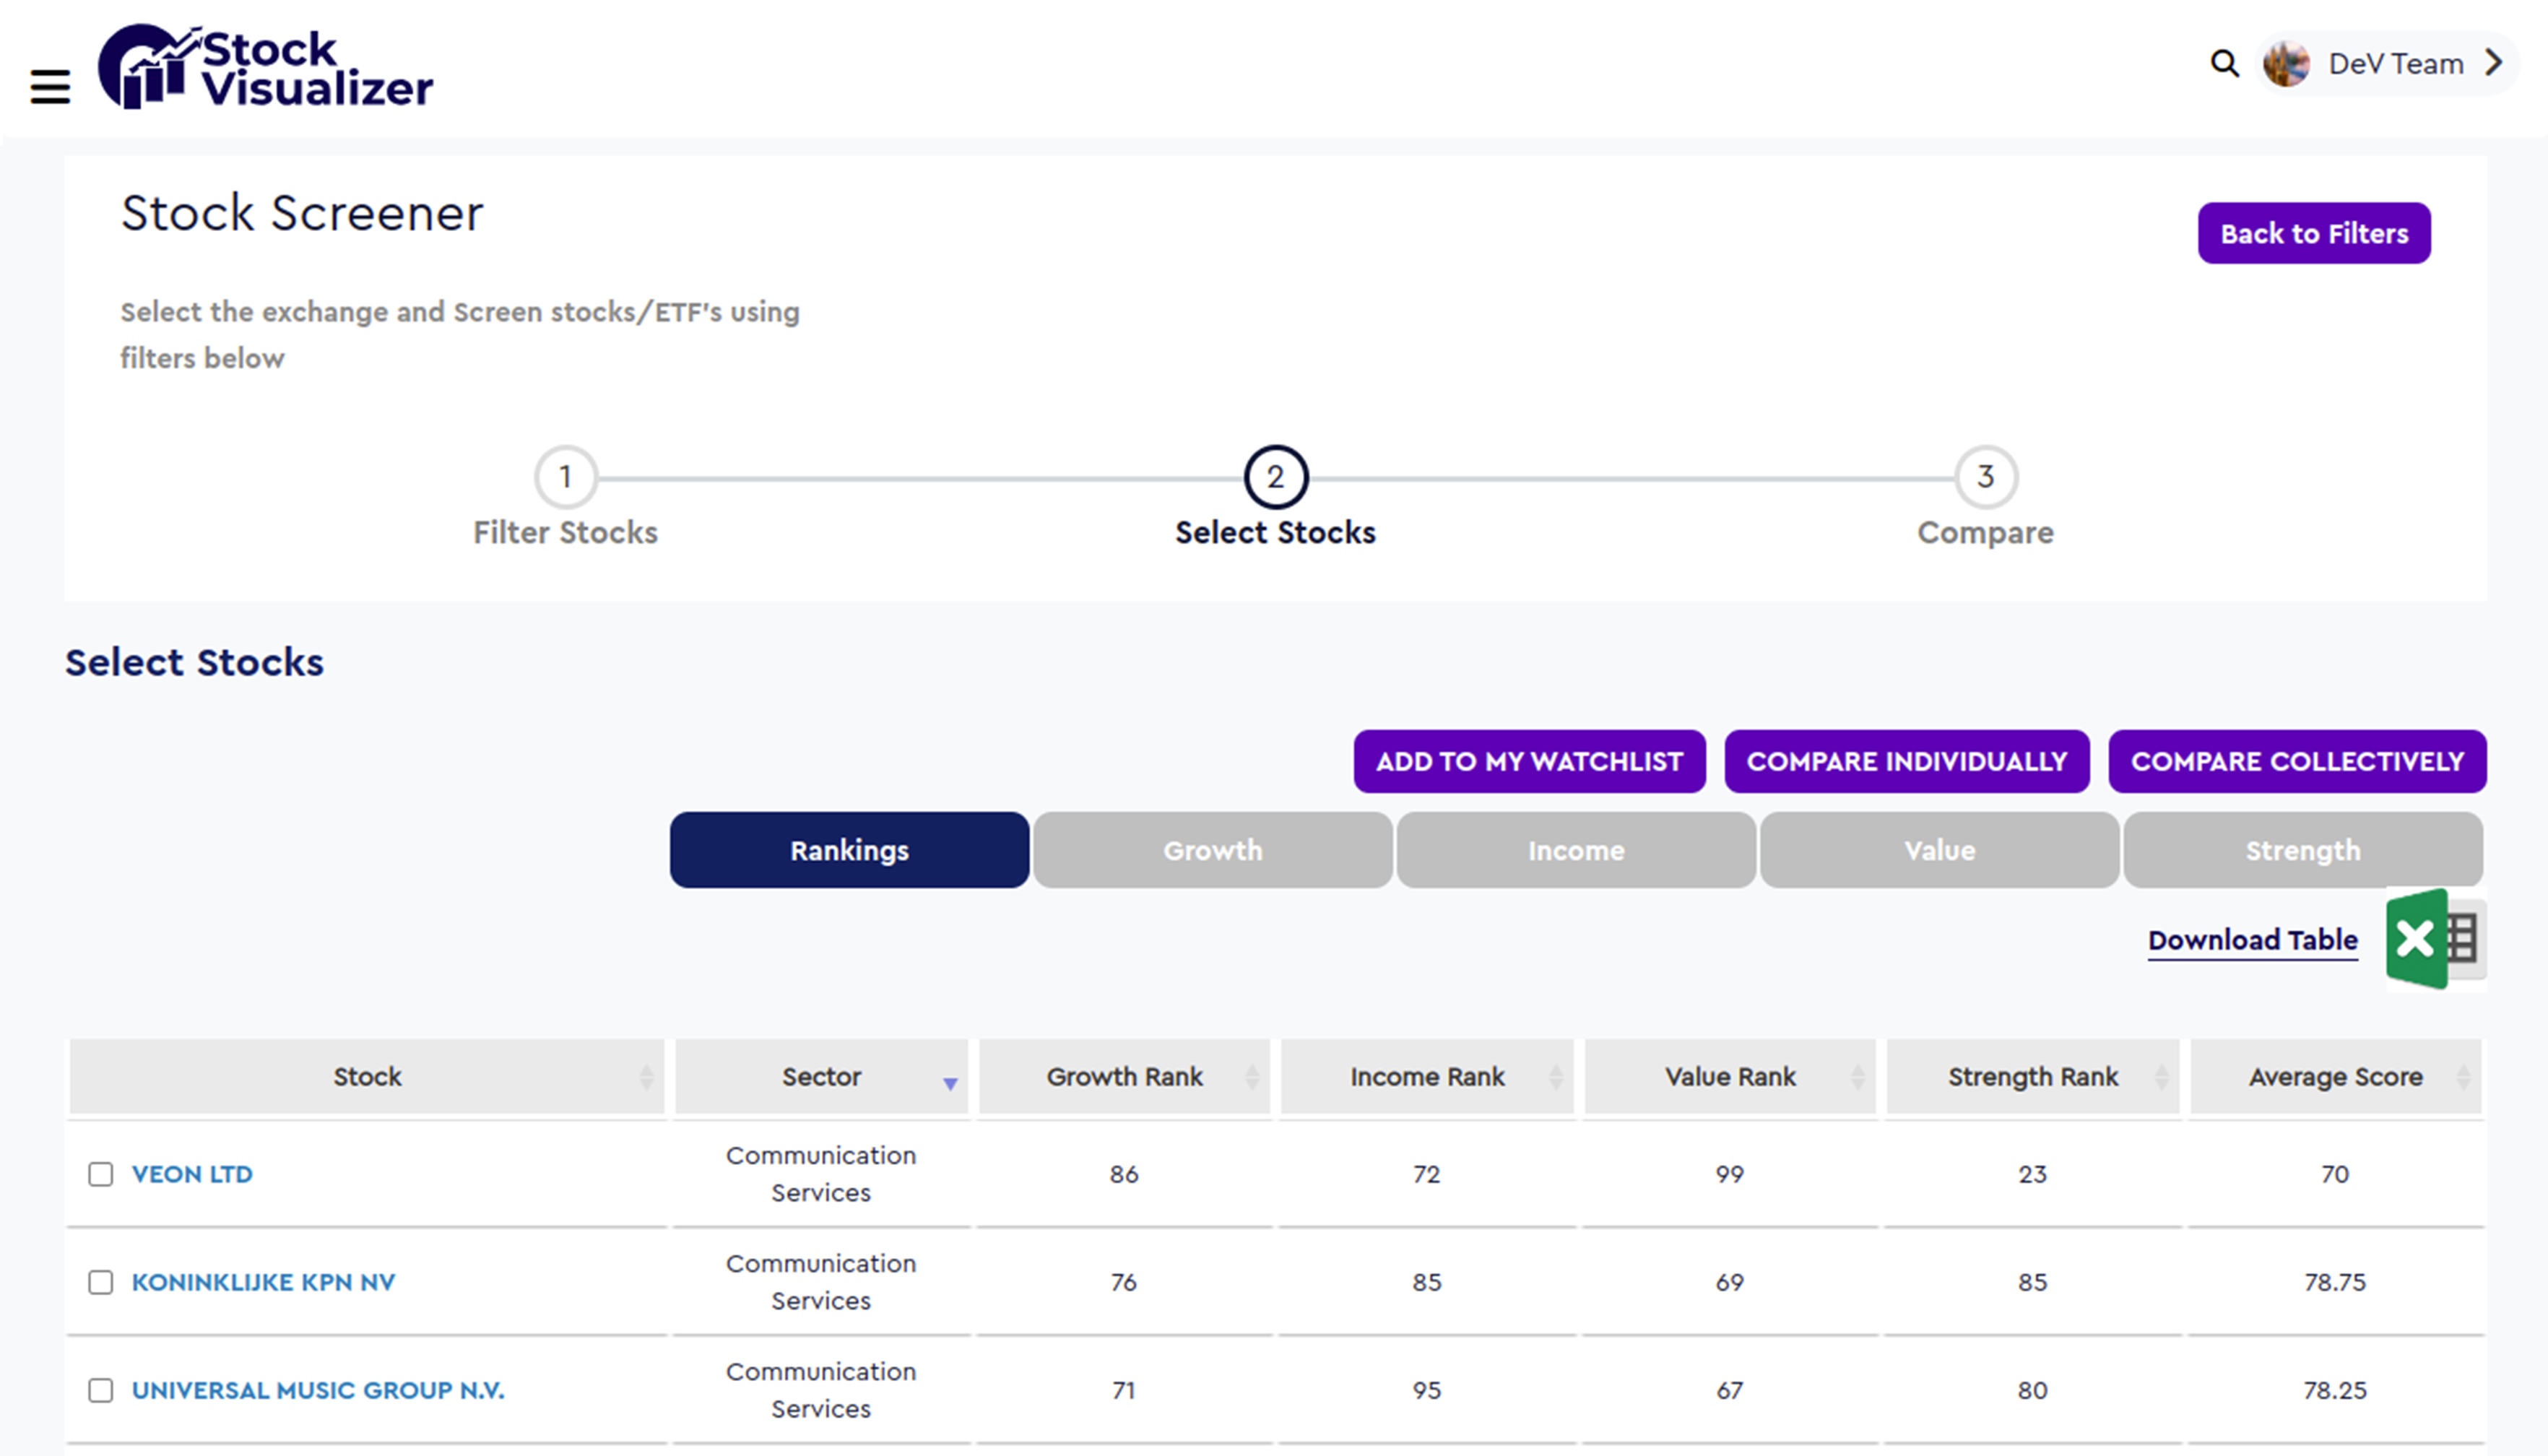
Screener
View or pre-screen top 10 or create your own Perfect Portfolio. Our screener enables you to filter Stocks, ETF’s, Funds and Investment Trusts from around the world based on fundamental Growth, Income, Strength and Value analysis
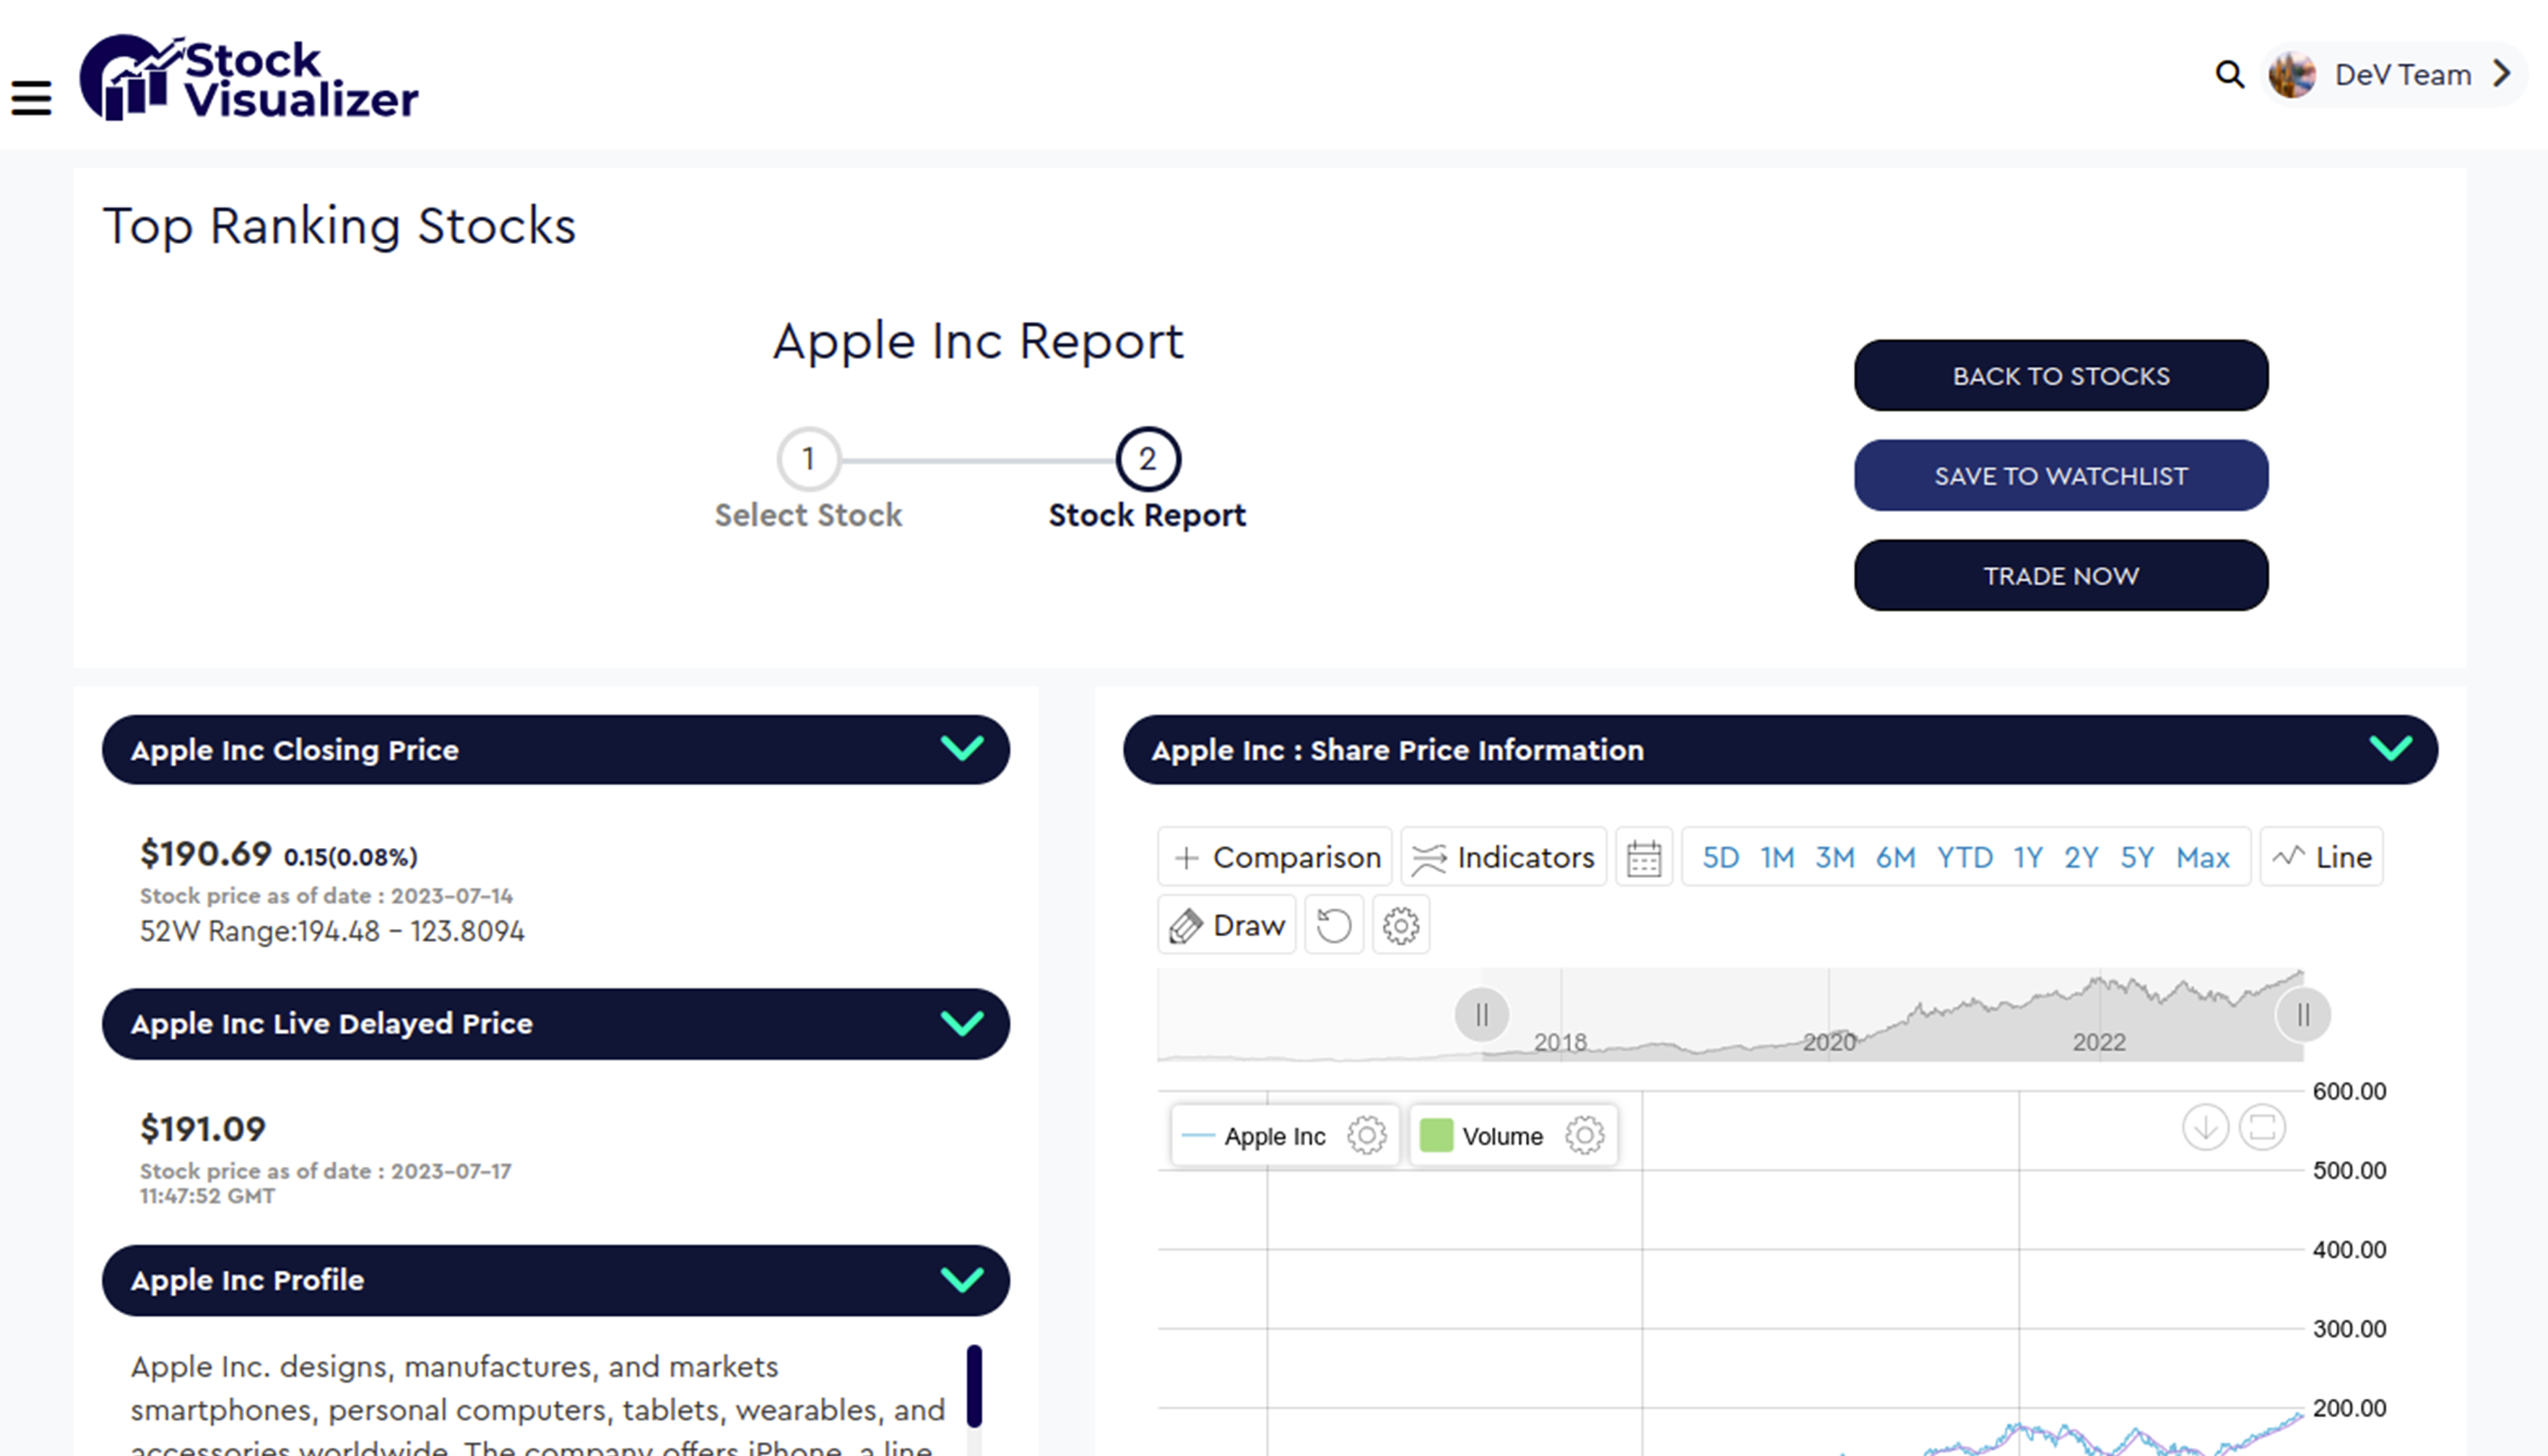
Stock Report
View company profile and corporate details alongside Stock Visualizer’s Rankings in addition to the latest company news, performance, trading history and latest Analyst Buy/hold/Sell Ratings
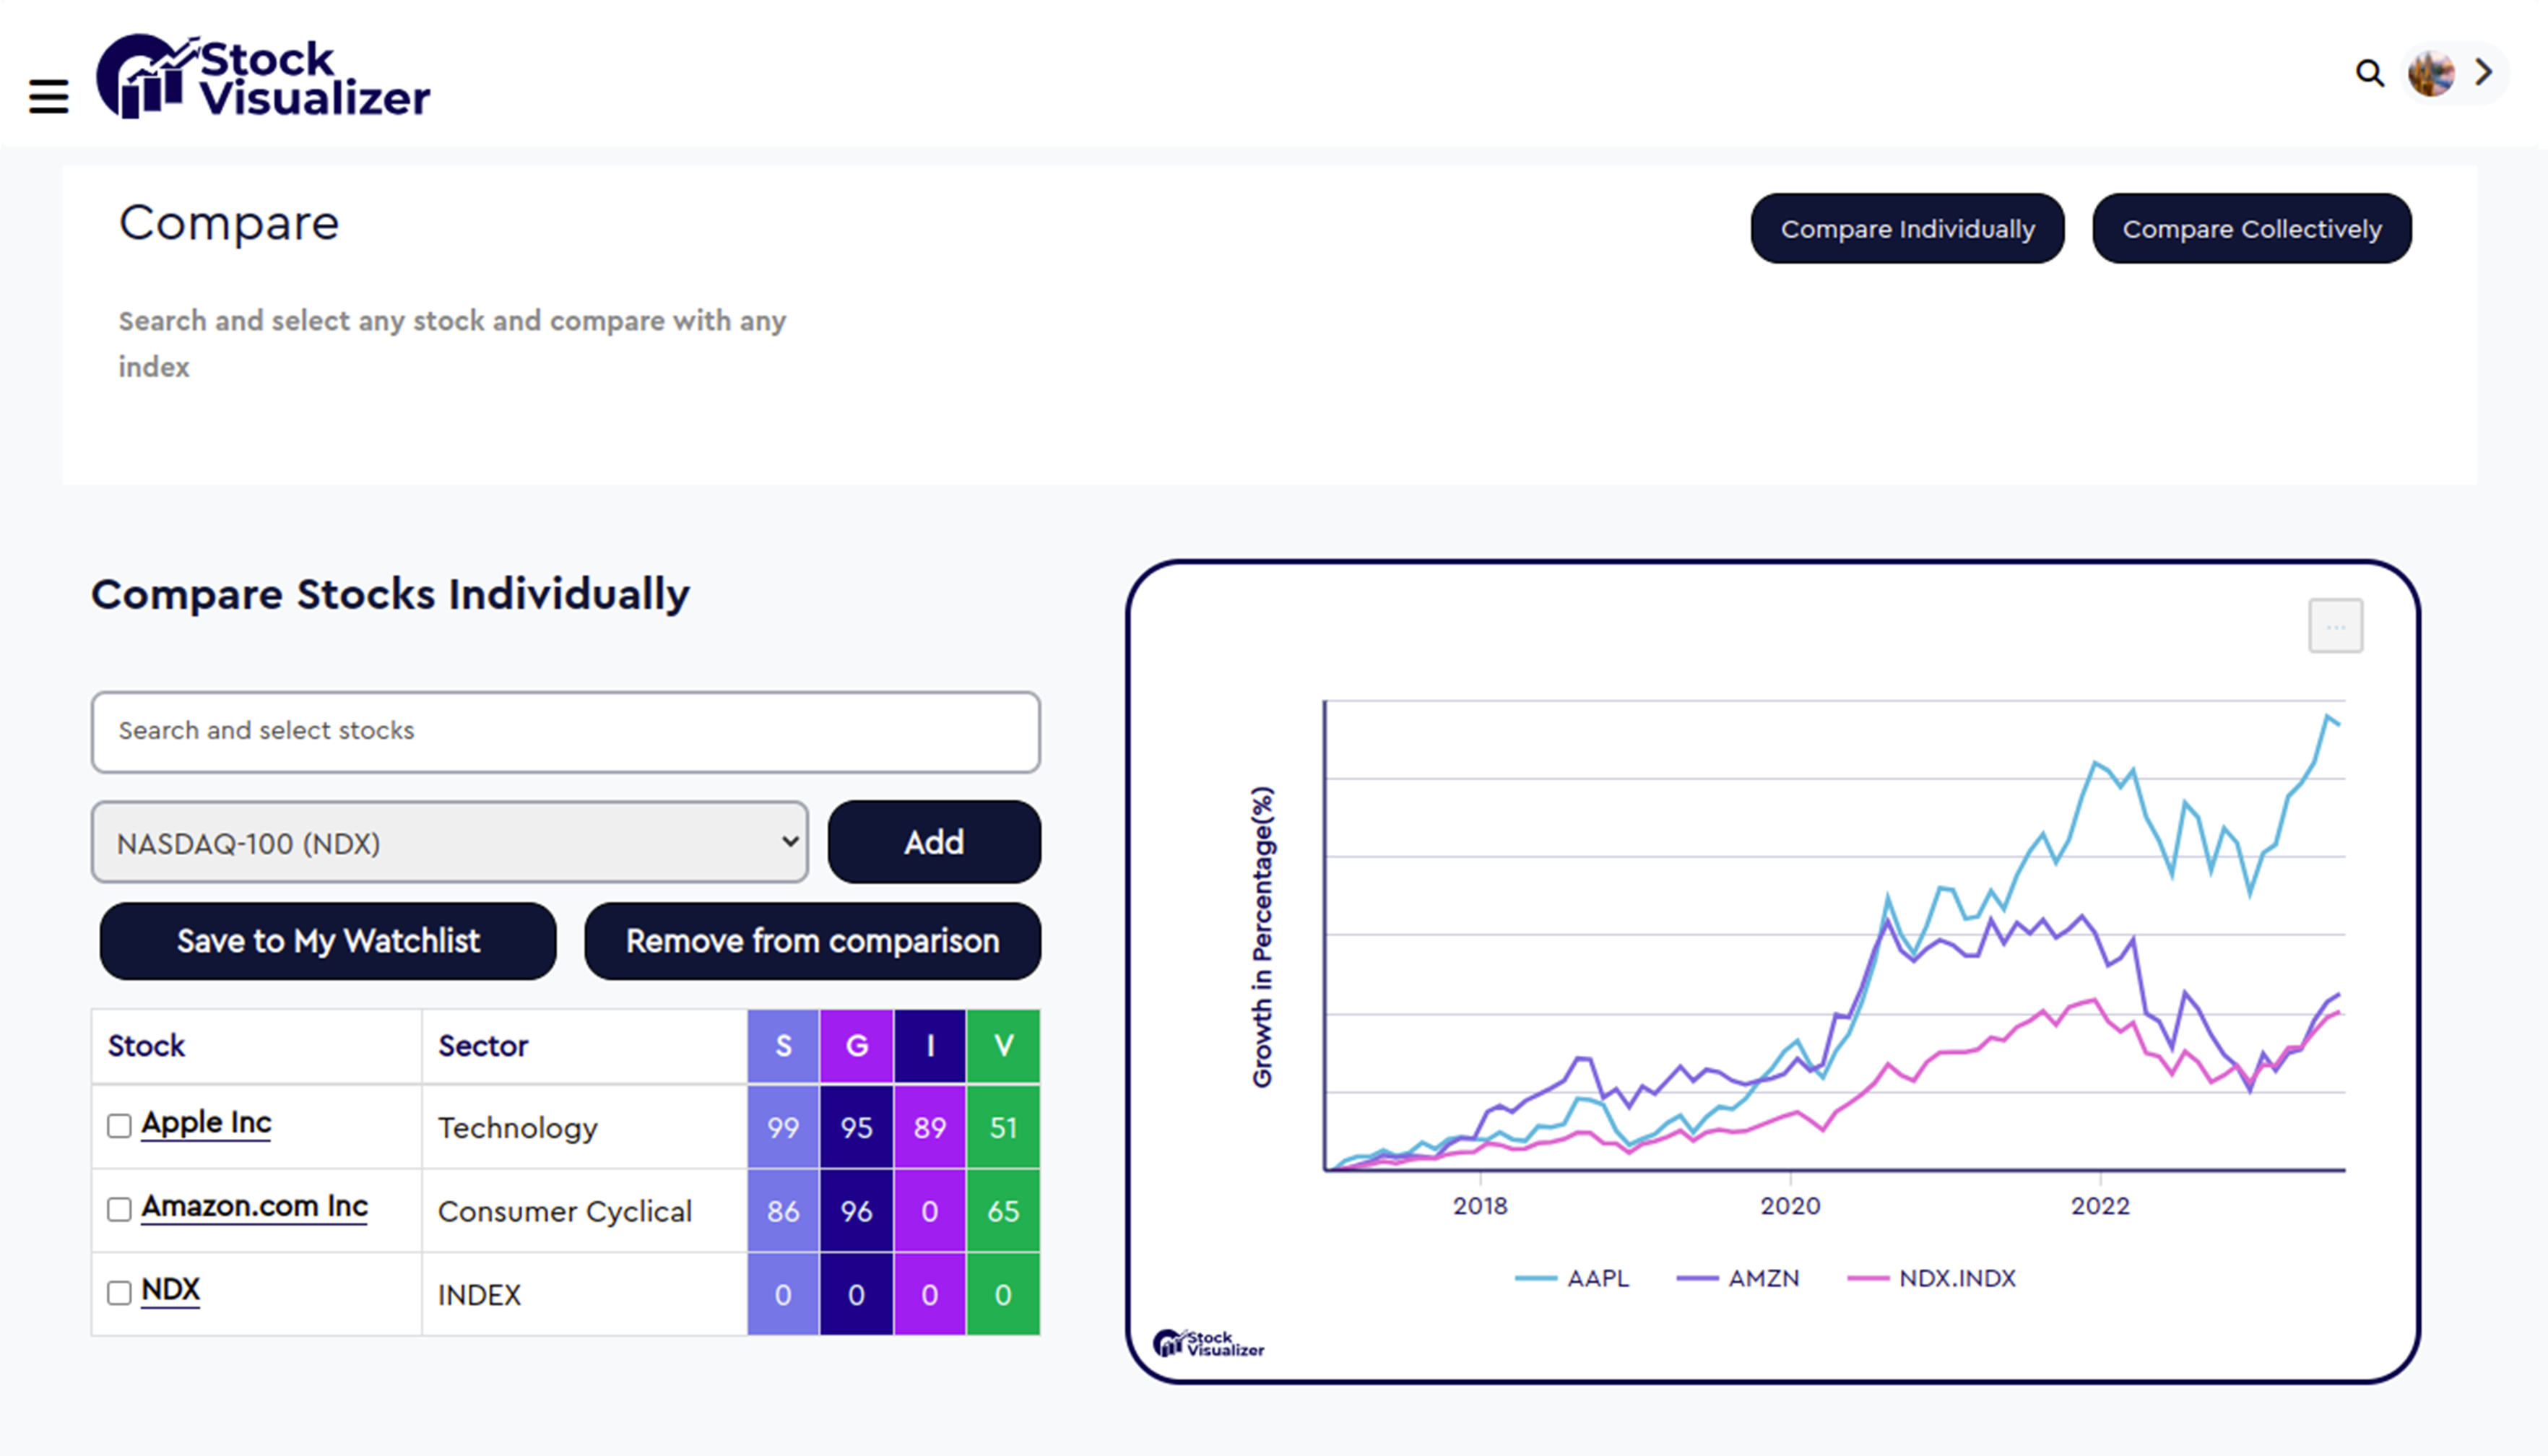
Stocks Compare
Compare and analyze multiple stocks,etfs and index funds.
Why use Stock Visualizer?
With over 150,000+ stocks, 20,000+ ETF’s across 70+ Stock exchanges all over the world, choosing the right investment has never been so complicated.
This is where Stock Visualiser comes in – we search and analyse the biggest stock markets every day and simplify all the jargon into 4 different Categories – Strength, Income, Growth & Value.
We rank every stock based on these four categories from 0 (Very Poor) to 100 (Excellent) enabling you to pick the right stocks for your needs.
Do you want high income generating stocks for retirement – view the highest income stocks. Do you want fast growing stocks – view our Growth Rank. Do you want pick the most financially stable stocks for the long term – view our Strength Rank. Do you want to find stocks that are potentially bargains – view our Value Rank.
Or filter a combination of the above – the choice is yours – we give you the tools to simplify and compare stocks across the world to enable you to pick the right ones for your needs.
BRAND ANALYSIS
GROWTH RANK ANALYSIS
STRENGTH RANK ANALYSIS
INCOME RANK ANALYSIS
VALUE RANK ANALYSIS

How It Works
We cut jargon and enable you to view the Strongest, Fastest
Growing, Biggest Income generating and Value bargains every day!
What Our Clients are Saying

Stock Visualizer has taken all the hard work out of investing and improved my returns. My go to resource for all my investments!
Enjoying Retirement

Stock Visualizer has saved me time & money finding the right stocks, growing my profit by 60% over last 6 months
CEO Persepolis Investments Ltd.